Quick Read
- One of the major implications of Apple’s rollout of SKAdNetwork is the newfound challenge of predicting & segmenting terminal user LTV from the first 48 hours of in-app activity.
- This is particularly difficult in verticals where a high % of revenue is concentrated in a low % of users, such as freemium gaming.
- Apple announced SKAD 4.0 in October of 2022, with the primary feature being two subsequent ‘coarse grain’ postbacks, which potentially provide feedback on user activity up to 35 days post-install.
- Little has changed since then with near-zero adoption, however we are now starting to see advertisers and networks begin to incorporate these features into their mechanics & strategies.
- The time is now for savvy iOS media buyers to begin mapping out their strategies for defining and tuning these new postbacks, which if done right will provide critical missing data for evaluating user quality across campaigns and channels.
- In this article we spell out the details of what’s changing and provide an example analysis of how you can begin to map out your own SKAD 4.0 strategy.
The SKAD <> LTV Problem
Apple’s SKAdNetwork attribution framework (SKAD) has generally forced advertisers to distill all future user value into a small number of early-cohort-age actions occurring 24-48hrs post-install. Outside of the impact to platform targeting efficiency, this had a disparate impact across advertisers according to two major variables 1) the frequency of user value signaling events that occur in the first 48 hours post install and 2) the variance in revenue per user (RPU) over time.
Generally speaking, there are three requirements for a durable SKAD Post-Install Event:
- Happens frequently (infrequent events are more likely to trigger the privacy threshold, resulting in null conversion values)
- Happens quickly (<24 hours post install to pass signal back to platforms & inform buying decisions)
- Predictive of future value (Predicts behavior we want)
To start, let’s take the simplest case: a Trial to Subscription product with a solid ‘Install to Trial’ Rate (7 Day Trial, Annual Subscriptions Only):
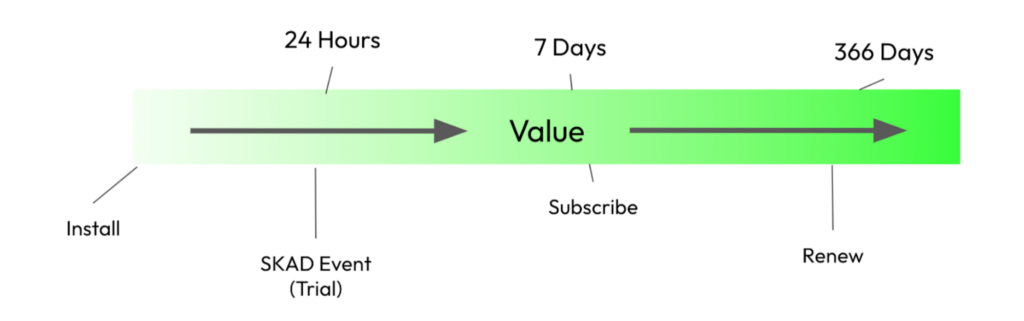
In this case, there is a simple approach to extrapolate from SKAD data to LTV at a 2 yr user age:
- Instrument the Start Trial Event in SKAD
- Roll-up all conversion rate and value coefficients including Trial Convert & Annual Renewal to back into a sustainable SKAD-attributed cost-per-trial target
This is a best case scenario for compiling LTV into a single event that plays well within the SKAD framework. However, distilling long-term user value to a single early event is a monumental issue for verticals that have high LTV variance on a per-customer basis, e.g. Marketplaces (Shein, Temu, WhatNot), Crypto Exchanges (Kraken, Coinbase), Games, Finance, and Insurance.

 Distilling long-term user value to a single early event is a monumental issue for verticals that have high LTV variance on a per-customer basis, e.g. Marketplaces (Shein, Temu, WhatNot), Crypto Exchanges (Kraken, Coinbase), Games, Finance, and Insurance
Freemium games may face the largest challenge of all, with single-digit monetization and a small % of those monetizing customers explaining a significant portion of revenue. Without getting too technical, your run-of-the-mill LTV calculation has a much more significant and variable time component:

Because long-term retention and ARPDAU (Average Revenue Per Daily Active User) are the variables yielding ARPU, and much of this user activity occurs outside of a reasonable SKAD postback window, cohorts that look similar in a SKAD datastream can significantly diverge in value over time.
An example:
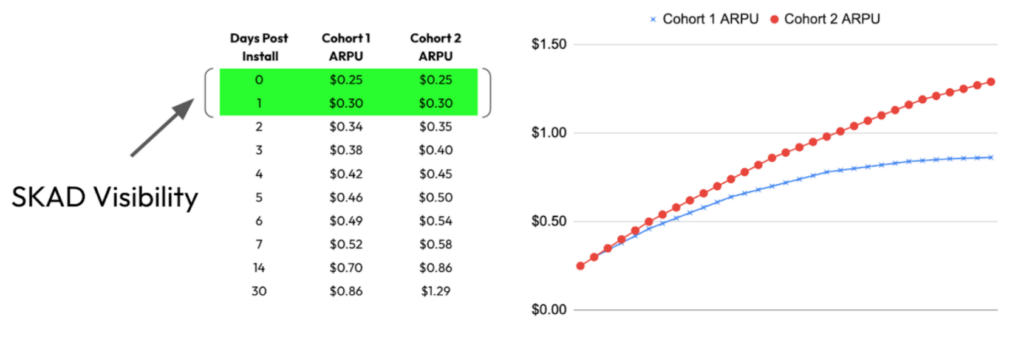
While these two cohorts originally looked equivalent in the SKAD datastream, you can see that Cohort 2 significantly outperformed Cohort 1 from a revenue standpoint even after just 30 days.
A Step Towards Fidelity
In October 2022, Apple announced SKAD 4.0, which featured two subsequent postbacks that should be able to communicate some medium-term value occurring after the first postback window closes. Unfortunately, SKAN 4.0 adoption has been slower than anticipated (the platforms – notably Meta – are generally not yet equipped to handle postbacks 2 & 3).
But, at long last, adoption across both advertisers and networks has started to pick up across the industry, according to this recent blog post by Appsflyer. This presents a clear opportunity for gaming advertisers to optimize their SKAD 4.0 configuration to maximize actionable value signals.
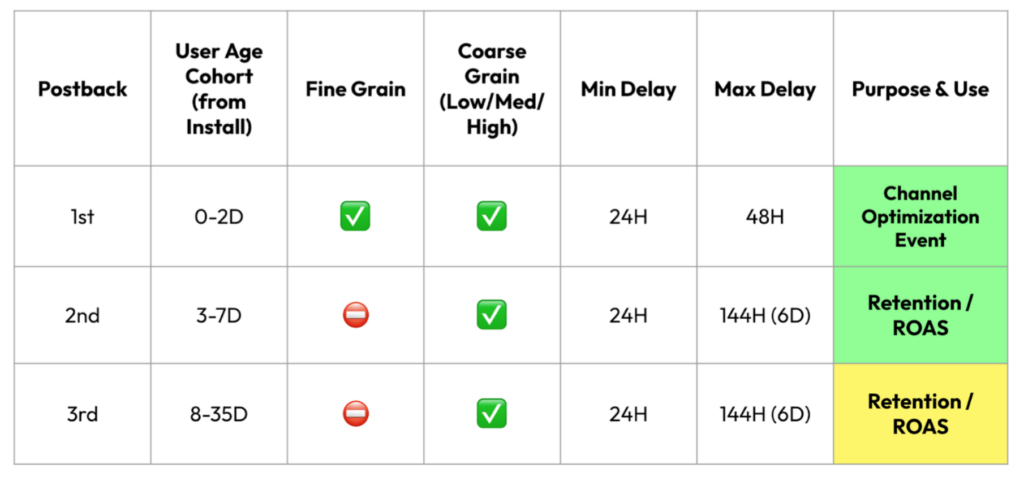
The three postbacks, what information they provide, and their practical applications are summarized below:
At long last, adoption across both advertisers and networks has started to pick up across the industry. This presents a clear opportunity for gaming advertisers to optimize their SKAD 4.0 configuration to maximize actionable value signals.
Postback 1: The Channel Optimization Event
The function of Postback 1 is going to remain firmly as the “optimization event” for event driven channels. Even when full & deterministic device attribution existed (a harken to my gaming days), most gaming buying operations were actioning off very early ARPU & monetization signals (Day 0, 1, 2 ARPU & Monetization %). That was because 1) buyers can’t wait 7, 10 days post-install to make budget + optimization decisions, and 2) the platforms themselves do poorly with longer optimization event windows.
Some sample event choices for Postback 1:
- Purchase
- Cumulative Session Length > X value
- Avg. Session Length > Y value
Postbacks 2 & 3: The Retention & ROAS Sorting Hats
This is where things get both interesting and potentially complicated, exposing a risk of making major mistakes. These postbacks return a “Coarse” value of low, medium, or high. The actionability of these postbacks heavily depends on how these low / medium / high values are “tuned” by the advertiser. The major task for the advertiser is to use existing user data to properly delineate how these buckets are defined for the purposes of LTV calculation and media investment decision-making.
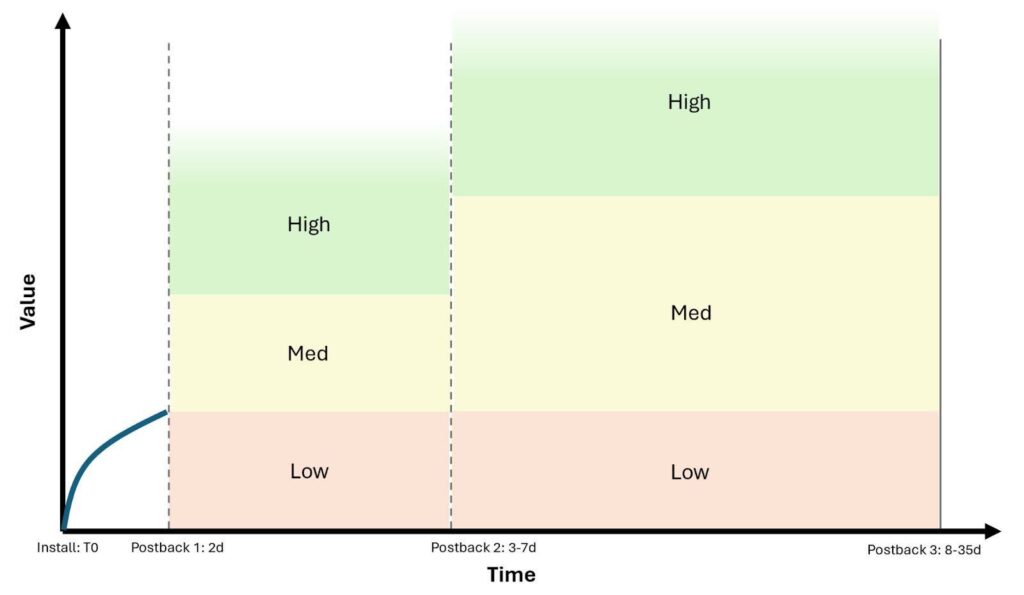
Coarse Postback Threshold Tuning
Ultimately, a similar analysis will be done for Postbacks 2 & 3, so we have grouped them into one section. Let’s start with a simple example of Postback 2 prep-work using cumulative purchase counts at Day 7. This time-series customer data would need to be aggregated at the user level using a product analytics tool or MMP. What is referenced below is sample data for illustration purposes only.
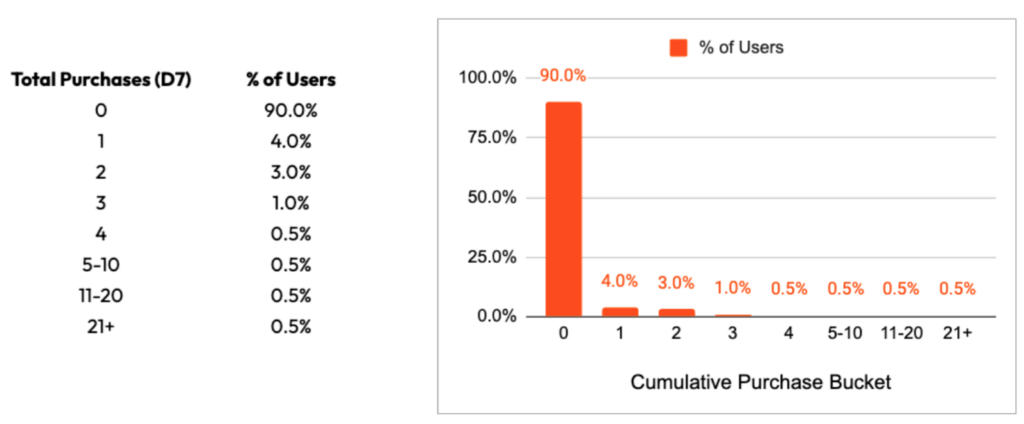
The above table details the % of users that fall into certain cumulative purchase buckets at Day 7 post-install. 90% of users do not monetize, 4% only make one single purchase, and 3% make 2 total purchases and so on. Now lets add in revenue & average transaction value to the table:
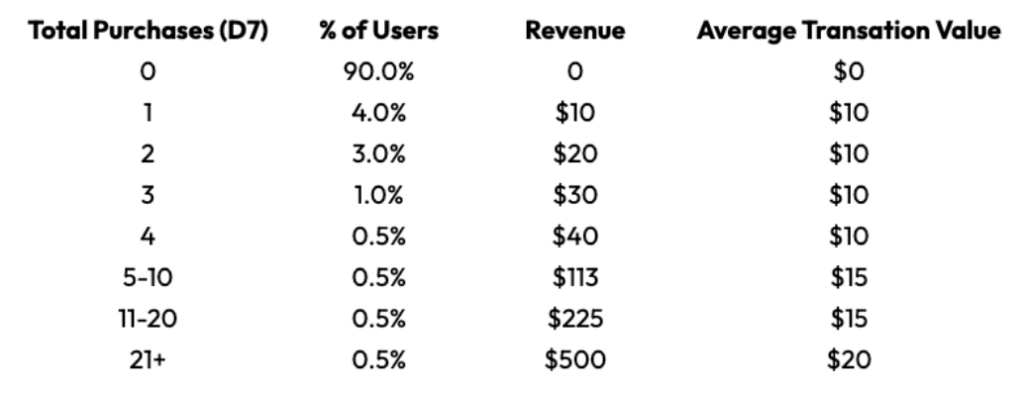
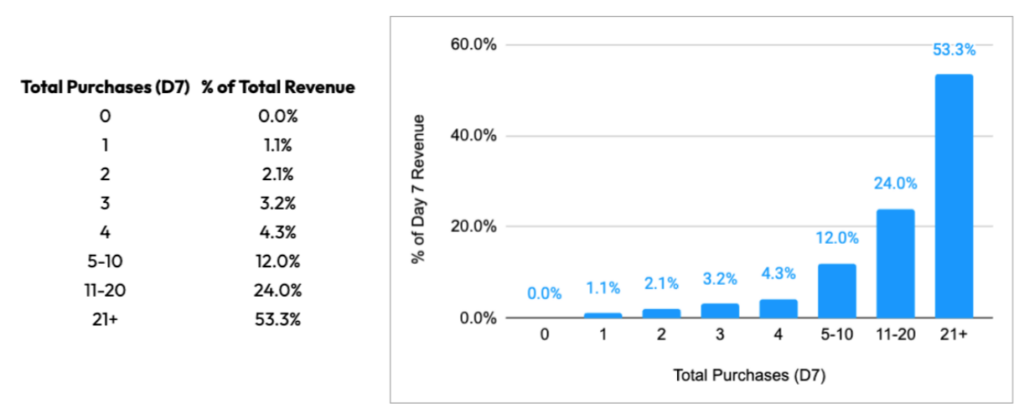
While more purchases are of higher value to the advertiser, the revenue analysis reveals a new insight: the Average Transaction Value of heavy repeat buyers is healthier than those who purchase < 5 times by Day 7. Partly due to this dimension, revenue is heavily explained by the later purchase buckets, with the final bucket explaining over half of total revenue:
The actionability of these postbacks heavily depends on how these low / medium / high values are “tuned” by the advertiser. The major task for the advertiser is to use existing user data to properly delineate how these buckets are defined for the purposes of LTV calculation and media investment decision-making.
Now that we understand the data we are ready to experiment with defining user buckets. We’re going to look at two different ways to define them and explain the shortcomings of some of the options:
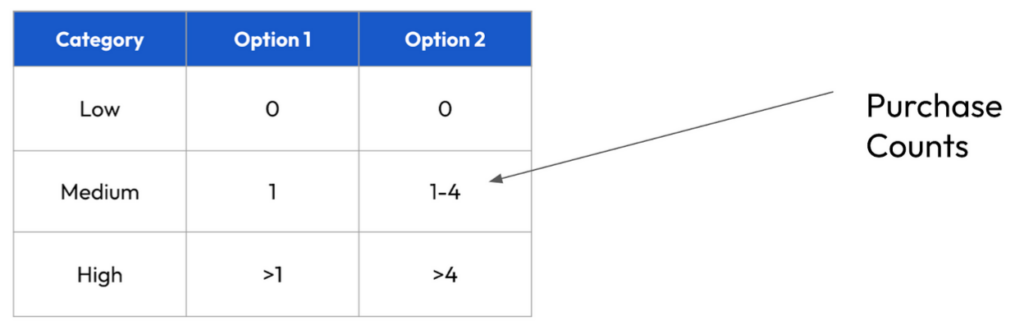
For Option 1, this advertiser has decided that Low = 0 Purchase events, Medium = 1 Purchase event (Purchaser) and High = 2 or more purchase events (repeat Purchaser). While there is nothing wrong with keeping Low = 0 purchase events, the key issue with Option 1’s setup is how the Medium and High tiers are separated. The best way to see this is by plotting the % of revenue that each bucket would explain for each of the options:
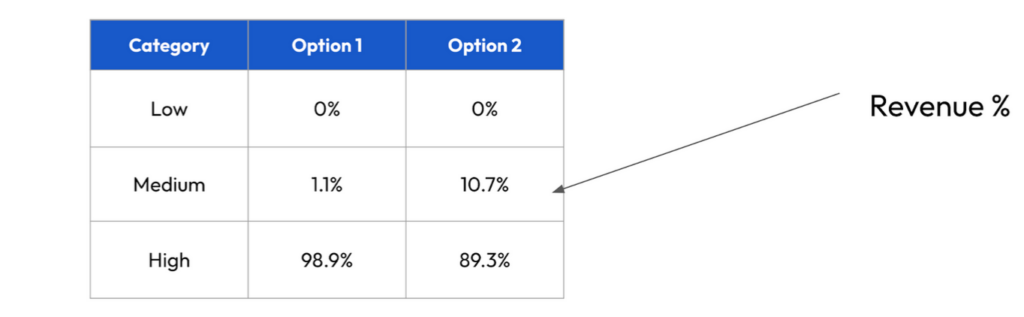
Option 1’s Low and Medium tiers combined only explain about 1% of total revenue, so the vast majority value is going to fall into the High tier. This means that, given a channel is producing monetizers at a reasonable rate, almost all of that channel’s revenue will be explained by High bucket users, making quality comparisons between channels and campaigns more difficult since the channels will likely report a similar high % of postbacks.
Option 2 is a step in the right direction, with a higher % of revenue explained by the low and medium tiers. While this setup is not perfect, it is more optimally configured for identifying the very small % of users who are explaining a very high % of revenue (higher actionability). A 20-30% difference in the % of High coarse grain values originating from a channel or campaign implies a major difference in the relative ROAS of these two options.
Let’s illustrate how this might work in practice with sample data from Channel A and Channel B:
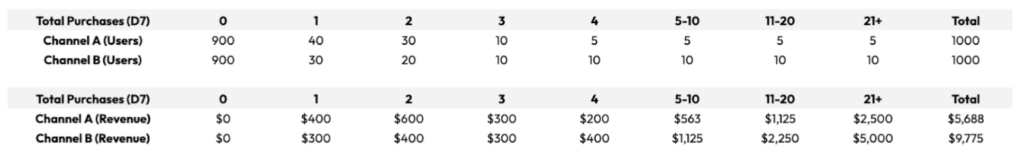
Both channels drove 1,000 installs and have exactly the equivalent number of monetizers, but Channel B has a higher % of extreme repeat purchasers, which ultimately yields 2X the revenue of Channel A. How would these two channels look if we were to purely evaluate them using our postback stream between Option 1 and Option 2? Lets take a look:
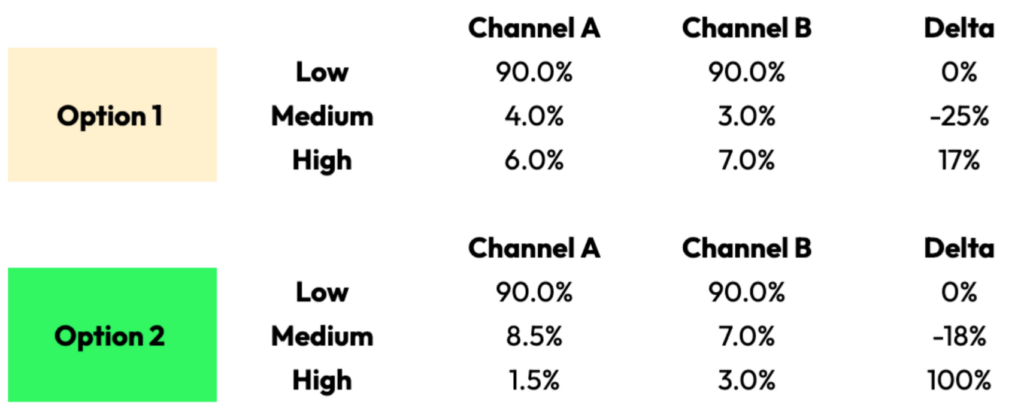
As you can see by the relative % of postbacks returned between these channels across these two strategies, Option 2 provides a much clearer signal that Channel B is providing a materially higher % of repeat purchasers, and is therefore responsible for higher revenue overall.
Final Thoughts
This is a major step forward enabling high-LTV-variance advertisers to evaluate the quality and ROAS of their paid campaigns. Ultimately there are still some unknowns here, this will be an iterative process for most advertisers depending on how their strategy plays out in practice, as well as how ad products develop around the Postback 2 & 3 datastreams. Notably, all eyes are on Meta.
SKAD strategy is a core piece of what we do here @ Headlight. If you have some of these issues and are looking for help evaluating your SKAD 4.0 setup, reach out to info@headlight.co for a consultation.
Headlight’s team of experts are offering a free strategic Audit Session across Growth, Creative & Analytics – a unique opportunity for brands to learn more about how to scale spend with incrementality in mind.