What You’ll Learn
A good creative strategy on Meta helps advertisers maintain performance in the face of increasing ad saturation and fatigue. A great creative strategy breaks advertisers into new audiences and drives huge wins in scale and efficiency. When paired with effective design, a dedicated testing program is what enables you to achieve both of these outcomes consistently over time.
In part 1 of this series, we dove into how creative strategy on Meta has evolved in the wake of iOS 14 for app and web advertisers. The winning creative playbook has shifted from modular design and large-scale variant production to more targeted, holistically-driven concept development. Structural changes in attribution and optimization mechanics have also changed the way we measure creative performance and iterate from market feedback.
What hasn’t changed? The need for independent and rigorous creative testing. But although testing remains critical, the terms for doing it well have evolved in pace with privacy developments. In this article, we’ll walk through how to build a successful creative testing program from the ground up based on our learnings over years of experimentation across clients at all levels of scale. We outline the key design goals and challenges from first principles and then show how they come together in practice through a case study. We’ll conclude with tractable takeaways that any advertiser can use to implement a testing strategy from scratch or iterate on one that’s already in place.
Creative Testing 101
Why test new creative independently? As we explained in part 1, assets that are rotated into your “business as usual” campaigns must overcome two related obstacles. One, the Meta auction heavily favors creative with a large amount of historical data. This incumbency bias explains why a small number of winning assets typically drive the lions share of volume in an ad account and can persist for many months. Two, Meta allocates a frustratingly small amount of test volume towards new creative when they are launched in competition with existing assets. The net result is that new creative is often killed before true potential can be ascertained.
Dedicated testing campaigns create a sandbox environment where assets can be evaluated without these complications and on terms set by the advertiser. With a well-designed process, testing makes finding new creative winners a controlled and repeatable endeavor. What does a well-designed process look like? Although test structures can take many different forms, successful ones share three key characteristics:
-
Every asset that’s tested receives an actionable sample of data against a target KPI, and does so within a set time frame
-
“Winning” assets identified in testing reliably achieve success when rotated into core campaigns
-
The above two are done at a pace and scale that justifies the test program investment and clearly ladder up into channel objectives
Getting all of these right is a tricky endeavor. Advertisers need to calibrate variables and manage tradeoffs in a way that fits their conversion funnel, functional resourcing, and account scale. We can loosely categorize these variables into three related questions that advertisers need to answer when designing a program:
1) How much creative do I need to test?
Determining the scale of your testing program is the first question to answer as it sets boundaries for every other design decision. How many assets should you test in a given week or month and how much should you spend to test them? The answers should be based on a clear understanding of needs, resources, and goals. We recommend a two step approach to untangling the problem:
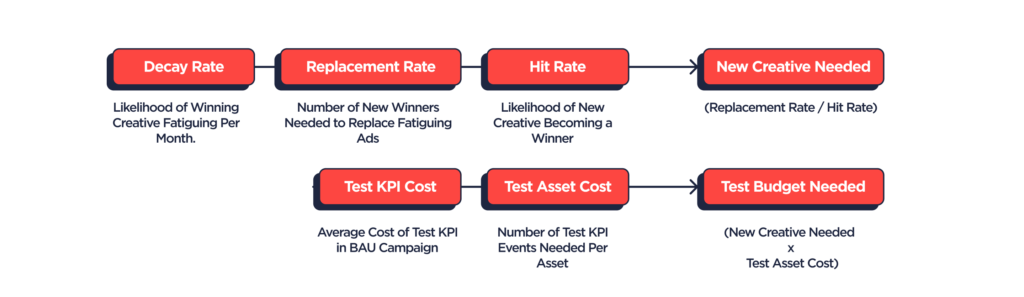
The first is a bottoms-up estimation of needs. How often do you need new creative winners in order to stave off fatigue on existing assets and maintain performance? How much do you need to scale or improve baseline efficiency? While not an exact science, you can math your way to an approximation by modeling probabilities based on historical data. What you’ll want to estimate specifically:
1. The decay rate on your existing creative assets, or how long they can maintain performance before fatiguing. This is essentially a gauge of the shelf life you can expect a high performing creative to have.
2. The required replacement rate implied by that decay function, meaning the amount of new creative winners you’ll need to have each month in order to replace fatiguing assets. Scaling or improving efficiency beyond your existing baseline will require some multiple of that rate.
3. Your expected hit rate on creative, or the percentage of new assets that end up matching or beating performance goals. Dividing your replacement rate by your hit rate tells you the number of assets you’ll need to make and test each month to find new winners at your desired pace.
4. Finally, the test cost of a new creative asset. This is how much you’ll need to spend on a new asset on average to get an actionable sample of data against your target test KPI (more on this later). Multiply that by your total asset count and you have a monthly testing budget.
It’s important to emphasize that all of these numbers are moving targets: they shift over time based on channel and platform dynamics and also from changes in your overall creative strategy. You’ll want to start with some data-driven assumptions based on actual data and revisit at a regular cadence as facts on the ground evolve.
Once you have reasonable assumptions on your scale variables, the next step is to calibrate this bottoms-up math against top-down goals and resources. It’s possible that your exercise in the first step implied a production and testing budget that’s untenable from an investment standpoint: unless the pay-off is commensurate, spending 20% to 30% of your overall channel budget on creative testing is not likely to be ROI positive. In that scenario, you’ll need to find a way to pare back and, over time, address the bottleneck variables: improving the hit rate modestly on new creative or iterating to a leaner evaluation KPI can have a dramatic impact on testing efficiency.
Conversely, there are situations that call for investment beyond the requirements implied by your historical analysis. Creative breakthroughs have a compounding effect on channel performance and advertisers that are early in their lifecycle stand to reap long-term rewards by getting them as soon as possible. Ultimately, production and testing are investments in future performance and present trade-offs on near versus medium and long-term ROI. The optimal balance will shift over time in line with goals and priorities.
2) How do I evaluate performance?
The second question to answer is how you’ll determine if a test asset is successful. In an ideal world, you would evaluate creative tests on the same metrics you goal the channel against. Typically, this is some measure of profitability: an LTV to CAC ratio, a breakeven projection, or, in certain circumstances, an average CAC or CPA target. In reality, time and cost constraints on testing mean that most advertisers need to select a correlative KPI farther up the funnel to measure creative performance.
What are the constraints specifically? To test at a high-tempo, advertisers need to be able to decision from data on a weekly cadence. For products with a long conversion or purchase consideration cycle, this means that true CAC performance is out of reach within that time frame. This issue is compounded for iOS app advertisers by the postback window constraints on SKAdnetwork that we explained in part one.
On top of this, there is the cost of obtaining an actionable sample of data against your KPI on a test asset. How can we quantify this? Maximum sophistication here would entail a robust calculation of statistical significance: e.g. what it would take to get 80% confidence that the “conversions/impressions” ratio of a test asset is outperforming either that of a champion asset or, more leniently, the core campaign as a whole. In practice, we’ve found it more tractable to operate against a simple range that you can modify over time based on results (specifically, whether or not high performing test assets are reliably hitting expected goals once scaled into primary campaigns).
A sensible upper end volume estimate is fifty total events against a target metric: this is the benchmark Meta provides for ad set “liquidity” (meaning its threshold for having sufficient data to model outcomes against with confidence). As we’ll walk through in the case study below, fifty events can be an expensive target–for a $100 CAC target, this would entail $5,000 of spend for every test asset. Empirically, we’ve often found success operating at a more reasonable threshold of 30 events per week. You’ll want to do your own homework here, but planning against a range of 30 to 50 target events per week per ad is a sound starting point.
Test KPI selection is ultimately a trade-off between predictive power and predictive efficiency. Advertisers with a complex funnel, high CAC, or high variance LTV will need to be iterative and smart in metric design. Test performance is also not a black and white question: while operating with clear pass/fail metrics is important, there are many edge cases and layering on measurement sophistication with time and scale will pay dividends. If you’re curious about how to build a deeper but tractable creative measurement framework, stay tuned for our next article!
3) How do I actually execute the tests?
Finally, advertisers need a methodology for building and managing test campaigns. This is a question of both media strategy–campaign structure, targeting, bid and event optimization–and process–your test deployment, analysis, and rotation cadence and the relevant cross-functional touchpoints. The former is where you’ll find the bulk of heated debate amongst media buyers on best practices. The latter is rarely discussed but is, in our estimation, as or more important than your specific campaign setup.
On Meta, optimal campaign strategies evolve at a high clip. “Best practices” tend to have a six to twelve month half-life before market and platform dynamics pull the rug on performance. There are also substantial differences in approach for app, web, and cross-platform products. Scale, product and market complexity are also important factors. Rather than tout a specific set-up, we’ll outline the key design principles:
1. Simplicity: post-iOS 14, complexity comes at a huge cost on Meta. The more dimensions there are to a campaign structure, the more difficult it is for Meta (and the advertiser) to model outcomes and attribute accurately. Advertisers need to find a way to work around the diminished signal available to ad-level data on both SKAdnetwork and web-based campaigns. This means as few concurrent ads, ad set, and campaigns as possible.
2. Relevance: the goal of a test campaign is to identify creative that has a high potential for success in your core campaign mix. As such, campaign parameters should be as similar as possible between the two. Optimization events should always be the same. From a targeting perspective, your best bet is to carve out a ‘clean’ (ie. mutually exclusive) population that closely aligns with the audience that the core campaign(s) for these tests are running against. An example would be if you are scaled against a 0-5% LAL, use the 5-7% LAL of the same seed audience. For an Advantage+-heavy advertiser where you cannot have two campaigns in the same country with the same optimization event, consider using a smaller but demographically similar country for testing.
Whatever your specific set-up, it’s critical to have a well-defined process for deploying, testing, and analyzing new assets. Creative tests should be executed in a batched weekly or biweekly sprint with day of week consistency in when creatives are launched, when test data is gathered, and when analysis is assembled and delivered. Why? One, period to period consistency removes potential biases in analysis and streamlines trend reporting. For iOS advertisers, managing built-in delays on SKAD data makes this even more important. But most importantly, creative testing needs to be done in lock step with design and production. Delays in critical market feedback will have knock on effects on overall creative velocity and quality. Slips will always happen, but advertisers should mitigate by establishing realistic time-based KPIs to keep growth and creative work in phase.
To show how all of these questions are navigated in practice, we’re going to walk through a hypothetical case study. While the product and metrics are fictionalized, they are a median representation of situations we’ve encountered and solved for across dozens of companies over the last several years.
Case Study: Woofer
Woofer is a leading dating service that helps our furry friends match with potential companions. It’s a free service that monetizes with a subscription offering for its most eager canines. The subscription offering has allowed them to invest aggressively in paid growth at a positive ROI: Woofer spends upwards of $500,000 a month on Meta and typically recoups that investment within ninety days. Creative has been a key component in their ability to scale. After a year of trial and error with uneven creative performance, Woofer took stock of what was working and not and used that to design a high-tempo testing strategy that helped them discover winning assets with consistency.
Woofer’s first priority was to identify key trends across their top performing creatives. Over any given period, the team found that just two to four assets at a time were responsible for over 80% of the channel’s spend. These hero creatives drove big wins in efficiency out of the gate, but after a few months would deteriorate in click-through and top of funnel conversion performance. This degradation carried through the funnel to terminal ROI and frequently caused channel-wide scale or efficiency performance to fall below target. Woofer responded by rotating in lots of new assets into their core campaigns, but the existing hero creatives would still take the lions share of delivery for many months after their performance started to suffer.
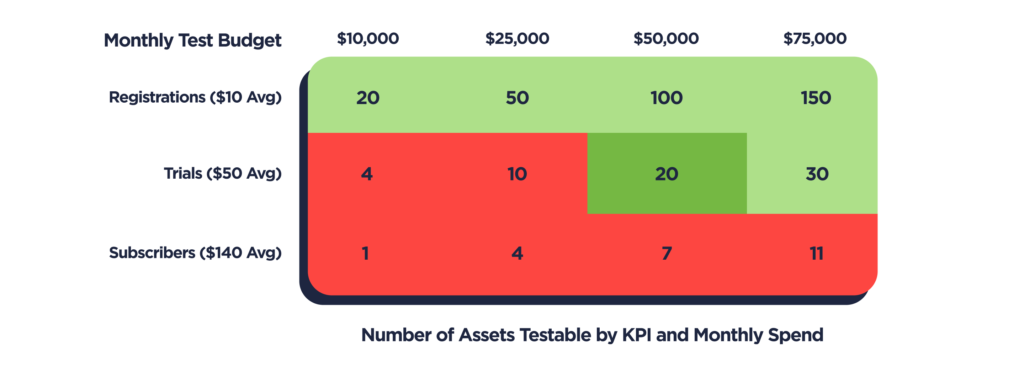
With at least one hero creative typically fatiguing every month, Woofer realized they needed at least one new creative winner to match in order to maintain volume and efficiency. Increasing scale or improving baseline ROI would require at least two and ideally more. Looking back at all the creative they tested over the prior year, Woofer saw that just under 10% of new ads were able to get traction. Assuming that hit rate would hold, they needed to test at least 20 new ads to find 2 new winners.
How much did they need to spend against those 20 assets to test successfully? Woofer’s ultimate goal is to drive new paying subscribers. If their paid media can drive new subscribers at a <$125 CAC, they break even within an acceptable time frame and can leverage that cash flow to reinvest into growth. But testing every asset against average subscriber CAC was a non-starter: that would mean $80,000 to $140,000 every month just on creative testing–up to 28% of their overall channell budget! Not only that, their free trial meant a seven day lag to their goal event: a tall order on web and impossible on iOS given the time constraints of SKAdNetwork.
At first, Woofer decided to move up the funnel and test against a cost per registration goal. At just $10 per new sign-up, Woofer could test all 20 assets for just $7,500 to $10,000 a month. Unfortunately after trialing this KPI for a month, they found that “winning” assets on a cost per registration goal often diverged significantly on monetization conversion. To test assets for true ROI potential, the Woofer team converged on cost per new free trial as their primary KPI. With an average cost per trial of $50, they could test all new assets each month for $30,000 to $50,000, or 6-10% over their overall media spend.
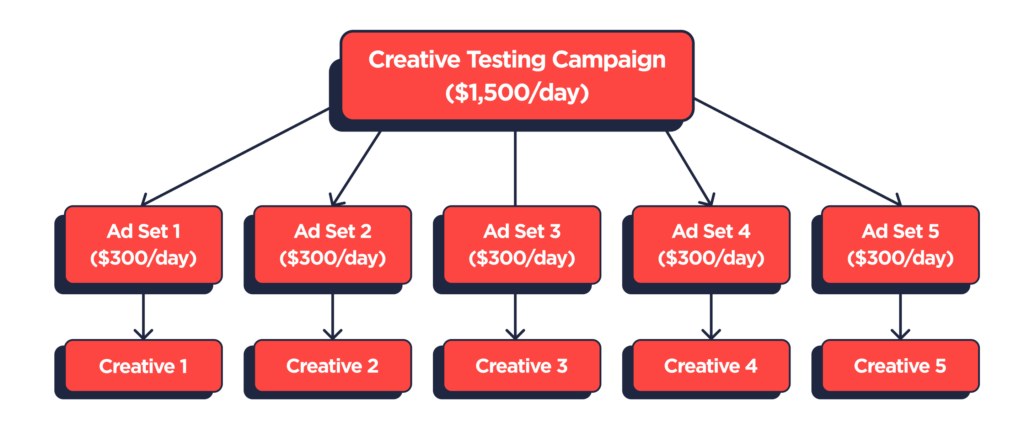
With the program scale and investment goals settled, Woofer then landed on a campaign set-up and process to execute the tests efficiently. As an app whose paying users skew over 70% towards iOS, Woofer’s testing strategy needs to align with the constraints of SKAdNetwork. Specifically, it must conform to Meta’s prescribed limitations on campaign structure and the diminished attribution signal it receives on ad set and ad level data. This meant designing a schema with as few moving parts as possible.
At twenty assets a month, this exercise is straightforward. Woofer can test five ads per week, with each ad mapped to a distinct ad set, under a single campaign ID. With a single ad per ad set, Woofer can force budget and delivery to a single asset and create predictability on the volume and time needed to evaluate against their test KPI. And by having only two real components in their campaign strategy–the campaign and the ad set–Woofer allows Meta to model conversions against a smaller number of dimensions (recall from part 1 that Meta has a fixed number of reserved IDs it can allocate across sub-campaign parameters).
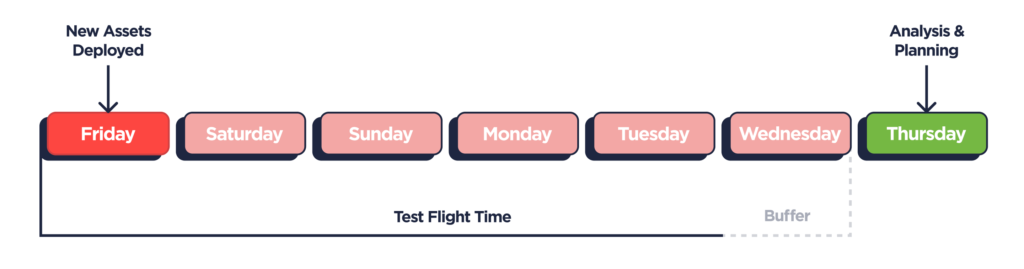
Woofer’s growth and creative teams then aligned on a process for executing the tests under this structure on a defined weekly cadence. The growth team planned for a five day “test flight” each week with ad set budgets designed for each creative to get just enough volume to hit thirty trial conversions assuming average costs lined up with their baseline expectation. They baked in an additional day for breathing room in case either more data was needed or if there was an unexpected delay in asset delivery.
This extra day also accommodated their SKAD conversion schema which involved in a 48-hour delay on new trial attributions. With new ads deployed on Friday AM, this meant the growth team had a roughly complete data set to analyze by Thursday AM assuming no unexpected delays. After iterating towards a measurement template and step-by-step analysis protocol, they were able to turn around a full report to the creative team that afternoon on what was working and not (more on how to do this in part 3!). This meant that by Friday’s design huddle, the creative team could plan the following sprint with a fresh understanding of in-market performance.
Adapting to Success (and Failure)
What impact did this revamped testing strategy have on performance? For the first few months, Woofer was able to create consistency in baseline CAC performance. The fresh and consistent rotation of high potential creative into core campaigns mitigated their reliance on legacy creative and the occasional degradation in hero asset performance.
With clearer and more structured feedback on creative trends, the design team was also able to accumulate learnings at a more rapid pace. After several months, they broke ground on a new design angle pulled from these insights and quickly landed on a hero concept that produced a huge leap in conversion efficiency. This new champion ad drove a 30% reduction in baseline CAC and the Woofer team was able to double spend to $1M/mo while maintaining target breakeven performance.
What happened next? Inevitably, the metric assumptions underlying their initial testing plan broke. After a quarter of success, Woofer’s new champion ads began to burn out at a faster clip. Compounding that was a slippage in hit rate: the creative team had optimized their way into small-scale iterations on the hero concept and it became harder and harder to drive breakout success with new variants. These developments created upward pressure on CAC and, with aggressive acquisition targets from the board looming, the team was faced with a classic scale vs. efficiency dilemma.
Solving for this type of situation requires a phase shift on goals and approach. After several quarters in “harvest” mode reaping the success of their new strategy, Woofer went back to the drawing board. To maintain their new level of scale efficiently, the team agreed to ramp their testing budget to 15% of spend and accelerate creative resourcing with an eye towards net new concept development. On the design end, this entailed re-framing core value propositions, conducting broad user and market research, and developing a revamped visual style around a set of new “big beat” messaging hypotheses. On the growth end, this entailed solving for a more complex testing schema to accommodate the increased volume as well as a deeper measurement framework that let them get to insights faster.
Ultimately, creative testing does not succeed or fail in a vacuum. Without the broader components of a creative strategy working in phase, even the most sophisticated test set up won’t work. Long-term success requires measurement, design, production, and testing to work together as an integrated process. In the rest of this series, we’ll cover the ins and outs of each piece of this value chain and how they connect together. For part three, we’ll dive into creative measurement post-iOS 14 and how to analyze creative performance in a way that leads to meaningful design learnings and hypotheses. We’ll also talk through how to use measurement to layer on sophistication in your testing strategy for both web and app advertisers. Subscribe below to get it in your inbox!
Reader Takeaways
Interested in revisiting your testing strategy or building one from scratch? We recommend working through the step by step exercise below. If you’d like additional perspective on how to apply this to your company, just give us a shout at info@headlight.co!
- Work with your growth and analytics team on a broad lookback analysis of creative performance. What trends can you identify in your asset mix in terms of shelf life, fatigue, and hit rates? How have those changed with scale or other external factors? How well do conversion and cost metrics at each step of the funnel correlate with actual ROI? Use the template above land on first pass assumptions on testing volume, evaluation, and success requirements.
- Align your program math with actual constraints on creative production, test investment, and overall channel goals and map out what deliverables and process should look like on a weekly and monthly basis.
- Put your findings into practice by aligning with leadership, growth, and creative teams on a 90 day testing sprint to validate your strategy. Set clear 30, 60, 90 day milestones on program success and refine operating assumptions and targets on a monthly basis.
- At the end of the sprint, pull together a retrospective focused on answers to the following questions:
a. Did the velocity of new creative winners increase? How often did creative winners in your test campaigns scale successfully when rotated into your core mix?
b. How did your assumptions on decay rate, hit rate, and evaluation KPIs change over the course of the sprint? How could you move the needle on any of these metrics to make your program more efficient? Could that be done through process or strategy improvements, or would it require additional resources or investment?
c. Based on the above, what should change in a subsequent 90-day sprint? What outcomes will tell you if those changes were impactful or not?
Get Growth Insights Delivered to Your Inbox